I stumbled upon a scenario and i nothing to chart with so i decided to check Fibonacci Retracement Levels.
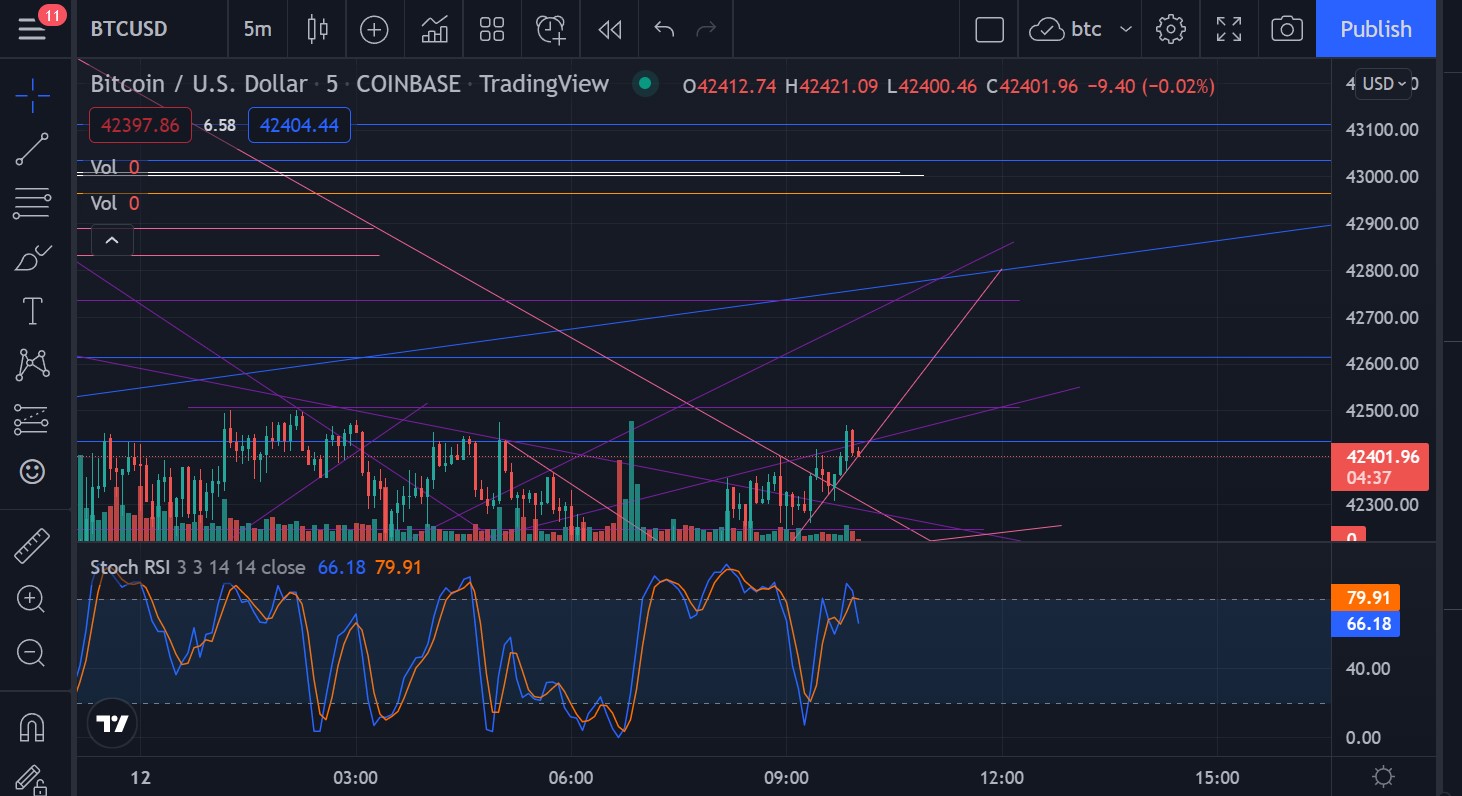
I did a chart for the 5mins $BTC because i was doing a leverage trading using Stormgain. I do micro chart as the sRSI moves up and down, and do a bigger support and resistances with it. $BTC was coming from a low and broke trend and i cant draw any trendlines, it broke the last trendline. So i decided to use the Fibonacci Retracement Levels to see whats going on or at least give me something to play with.
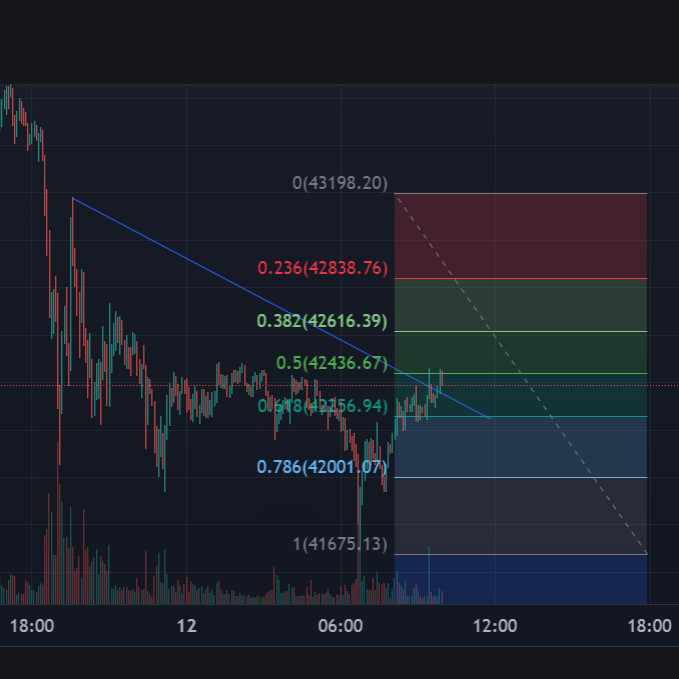
So i drew the fib from low to high and just wanted to see the .618 level. I opened another $BTC chart to see a cleaner and bigger picture without my 5mins charts.
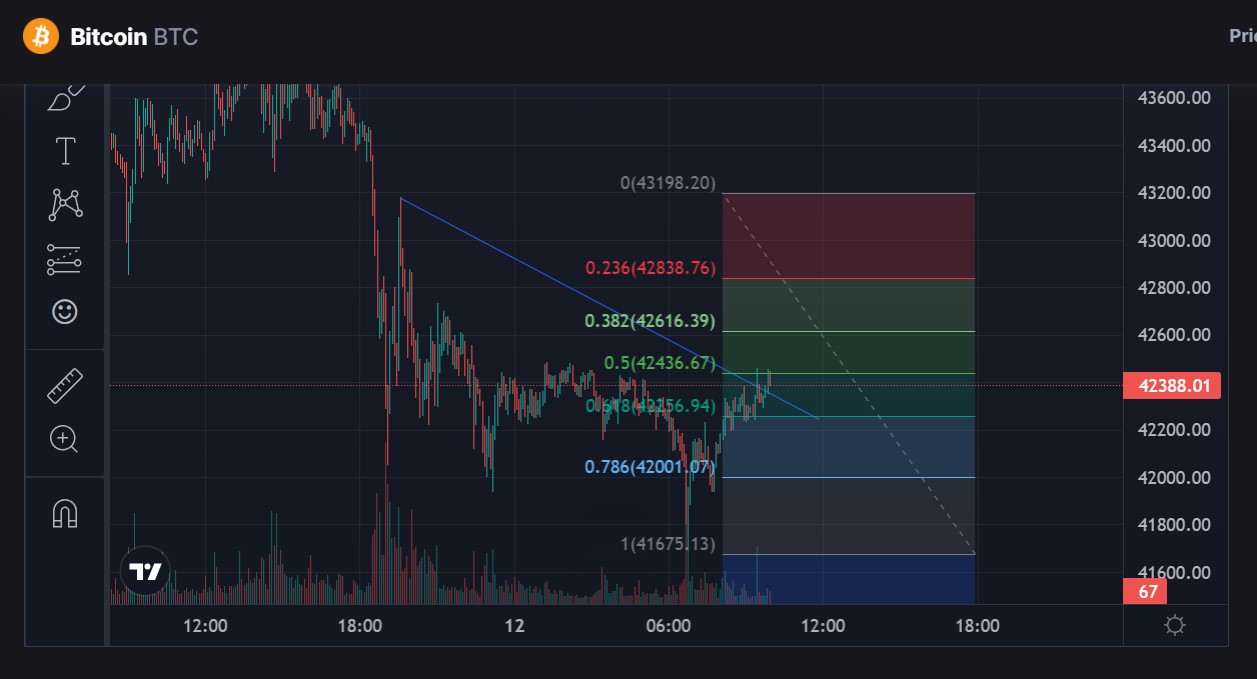
I was intriguted with the .5 level and the charts was hitting. So i went back to my other window where I have my micro and macro charts to see if i did some support and resistance charts that might coincide with the fib.
Much to my surprise, fib works!
1. .5 42
2. .382 42,600
3. .326 42, 800+ mine was below it but i have a long blue, purple and pink upward trendlines
I rest of the FIB more or less matches. I wasnt able to screen capture beyond .325 in the fib chart.
Always remember you have lots of signal and indicators to play with.