Predicting the where the market goes is very crucial.
Knowing where it's going can help you prepare your entry and exit level. And most specially, help you in erasing your emotions and better judgement.
A lot of things are shown in the charts but what i will be talking about here are Support and Resistance and the Stochastic RSI. Technical Analysis involves many market indicators. But I have to tell you that Fundamentals is king, price is a fool's indicator. Markets can be manipulated, so refer to your fundamentals first.
So can charts predict? is TA technical analysis important and effective?
Let's find out
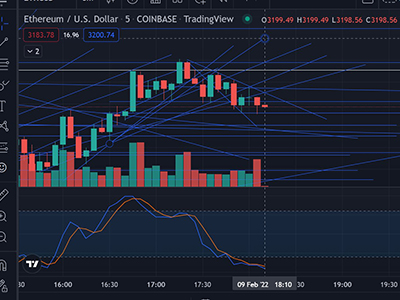
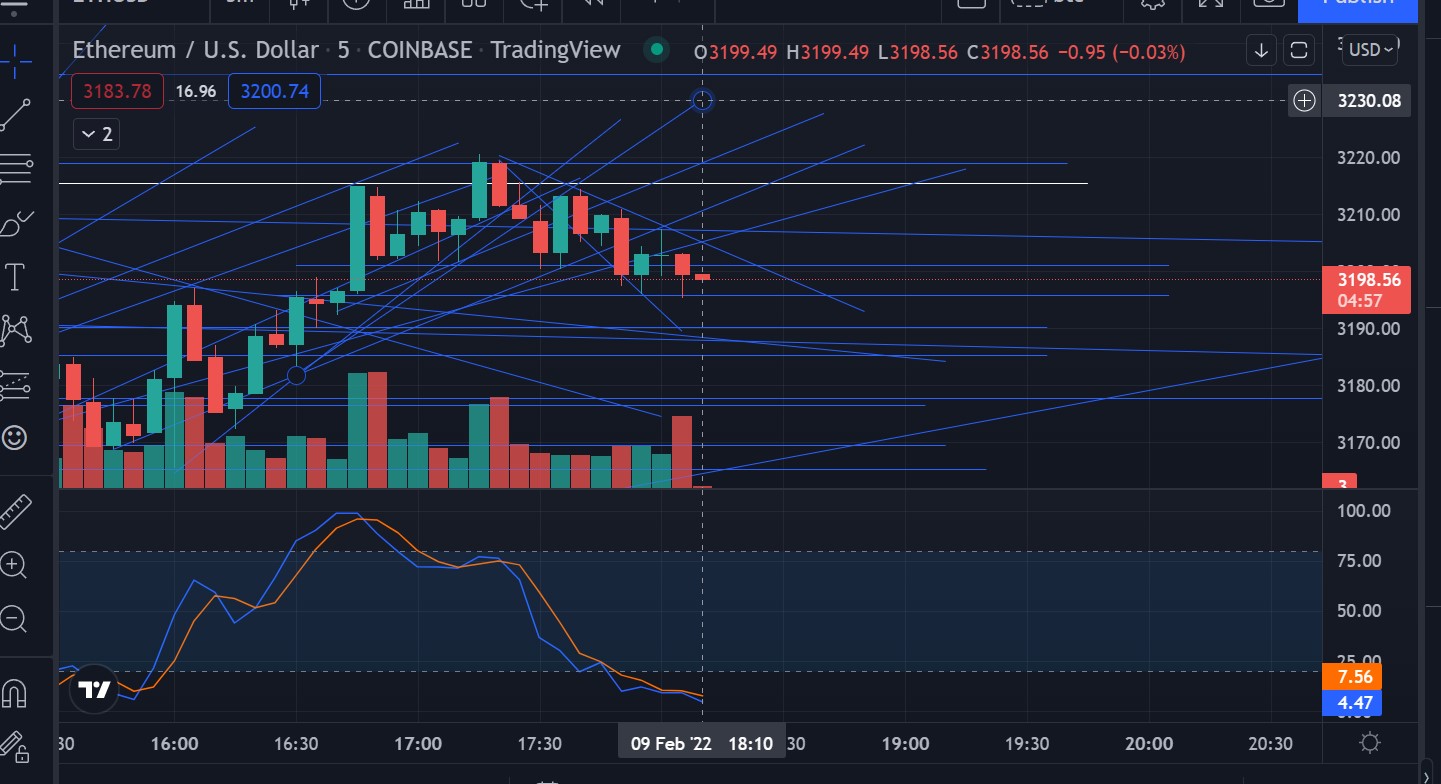
Below i have a chart for Ethereum $ETH in a 5mins time frame. This might not the usual charting you will see but this is how i am doing it. Blue lines are support, resistance and trendlines. Trendline will be diagonals.
Resistance are lines you are approaching and as you pass it, it becomes your support. Meaning, as you approach the line from below there might be some resistance, you can approach a line couple of times, even more and as you break it, it becomes support, meaning as you approach the line from the top you will be supported by it, and a bounce back.
Stochastic RSI indicates the selling and buying. Oversold and overboth, what we are looking for using this is the reverse of the trend.
Anyway, look at the chart i did, those lines
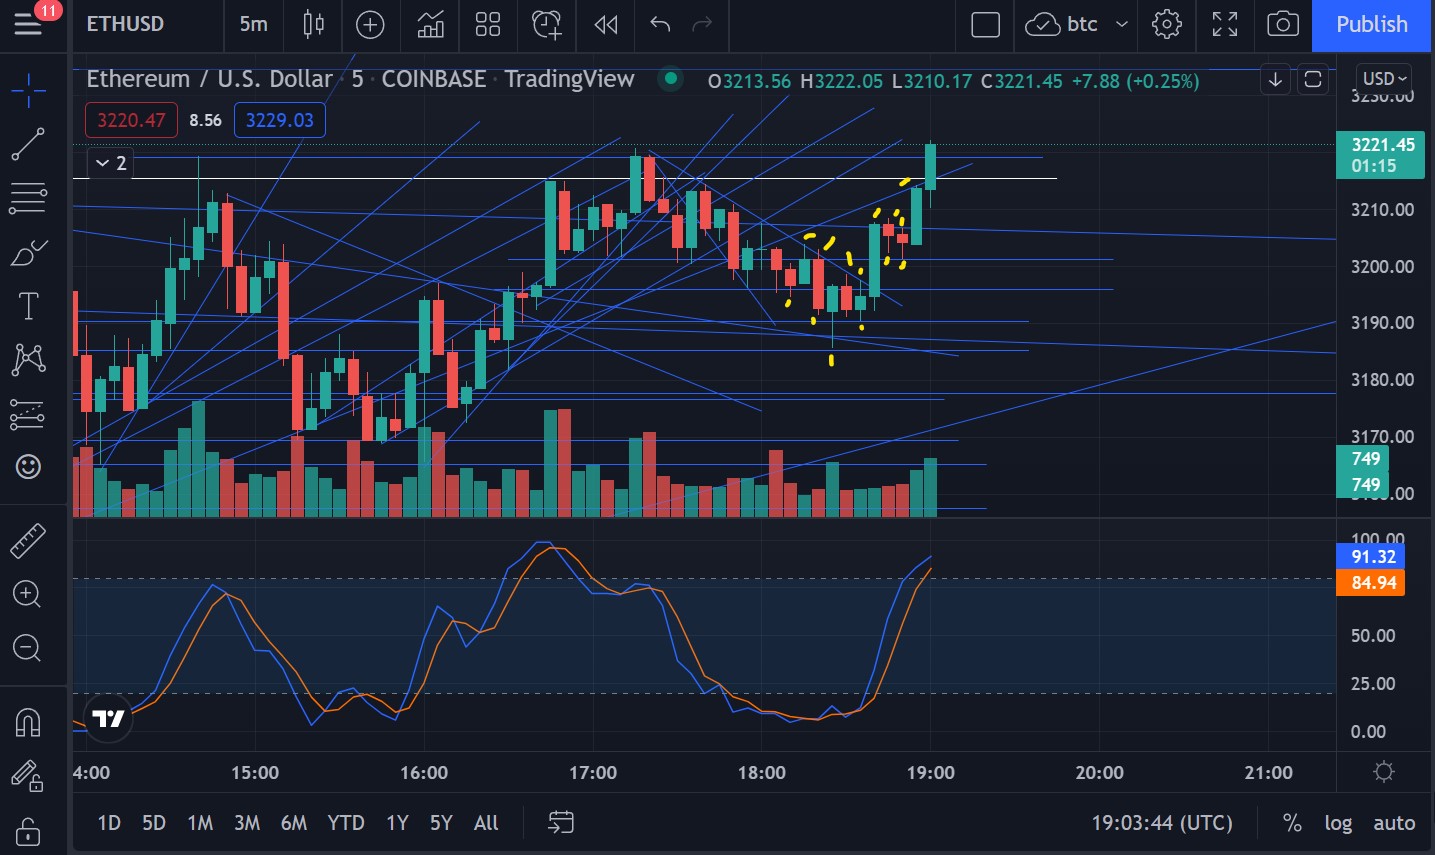
As the trading continues i didnt update, meaning added, I dont change trendlines, it just extend it. Add meaning it might have created a new resistance or a support, depends on the factors in the market that wasnt available previously. I didnt update since i want you to see the same chart as the market moves.
Below is the moving with the same chart
I will walk you through each candle. We started with the red bar from the previous screencap, noticed it from the previous it was hitting the line i did, resistance, it then turned red and the previous candle was a red due to the resistance, but it didnt goes pass the support, noticed the candle wick testing the support line. It was supported and continue to test resistance and broke it but tested the downward trend line and then noticed as it hit the trendline it got reject and fell to another support line. As new candle is created the red becomes green because of the support. Now, the previous support line is now a resistance, it pass it but did pass the trendline. Then the tight trendline and support.We have tested the trendline more than twice and support has been strong so the break of the downward trendline, notice the stochastic RSI change of trend. Now a big green candle hitting a slight diagonal line, this is a big daily down trendline, it got reject, so red candle after. Noticed it two red candles are supported. After two attempts breakout and hit another trendline, it stalled here and new candle broke the trendline to go up passing another resistance. Notice the sRSI, hitting the top already, and about to reverse, which it did and did created some red candles but got support.
So to wrap it up, yes chart can help you eliminate your emotions from trading, not knowing supports you would have sold out your positions in fear of losing more but with the chart you know it will bounce with support and if not you know there is another. And with reference to sRSI you know when to come in and when to exit. When to buy so you wont be buying when the trend is going down or vice versa.