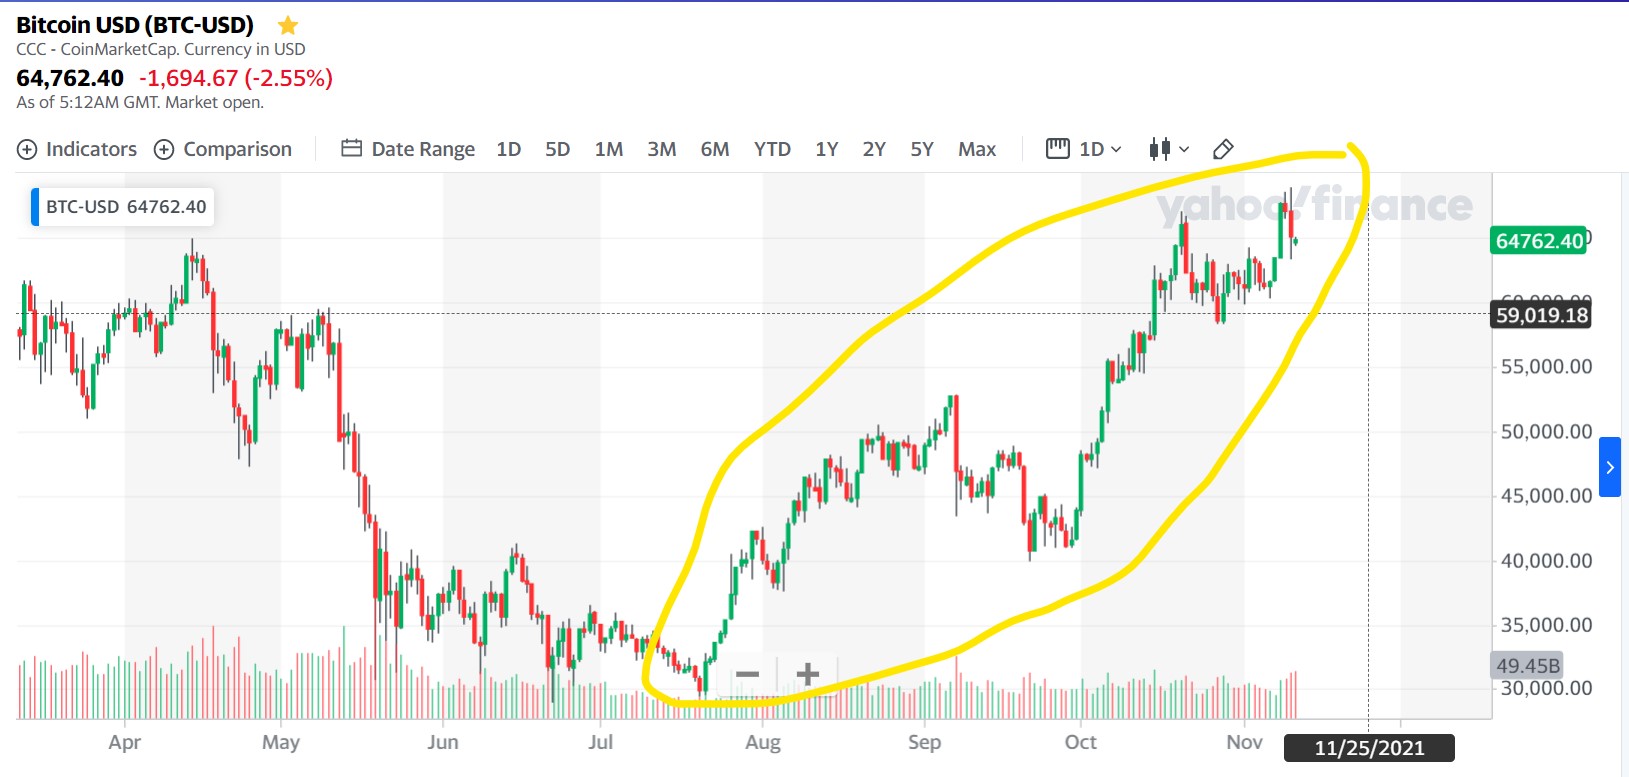
This is November 2021 BTC chart not 2017
Let's compare
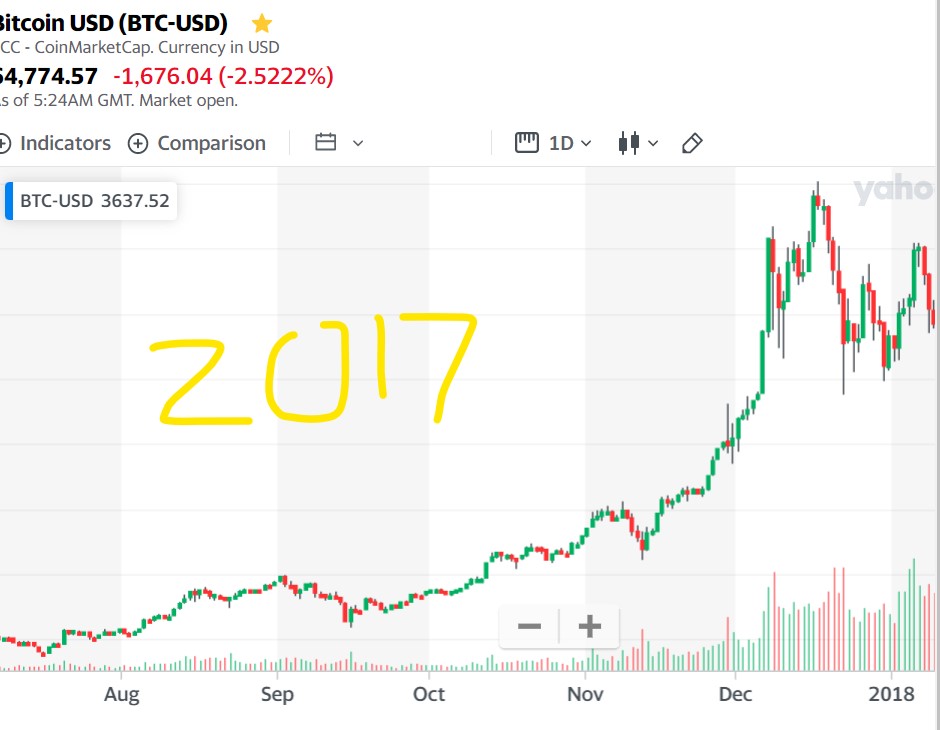
This is 2017 BTC chart
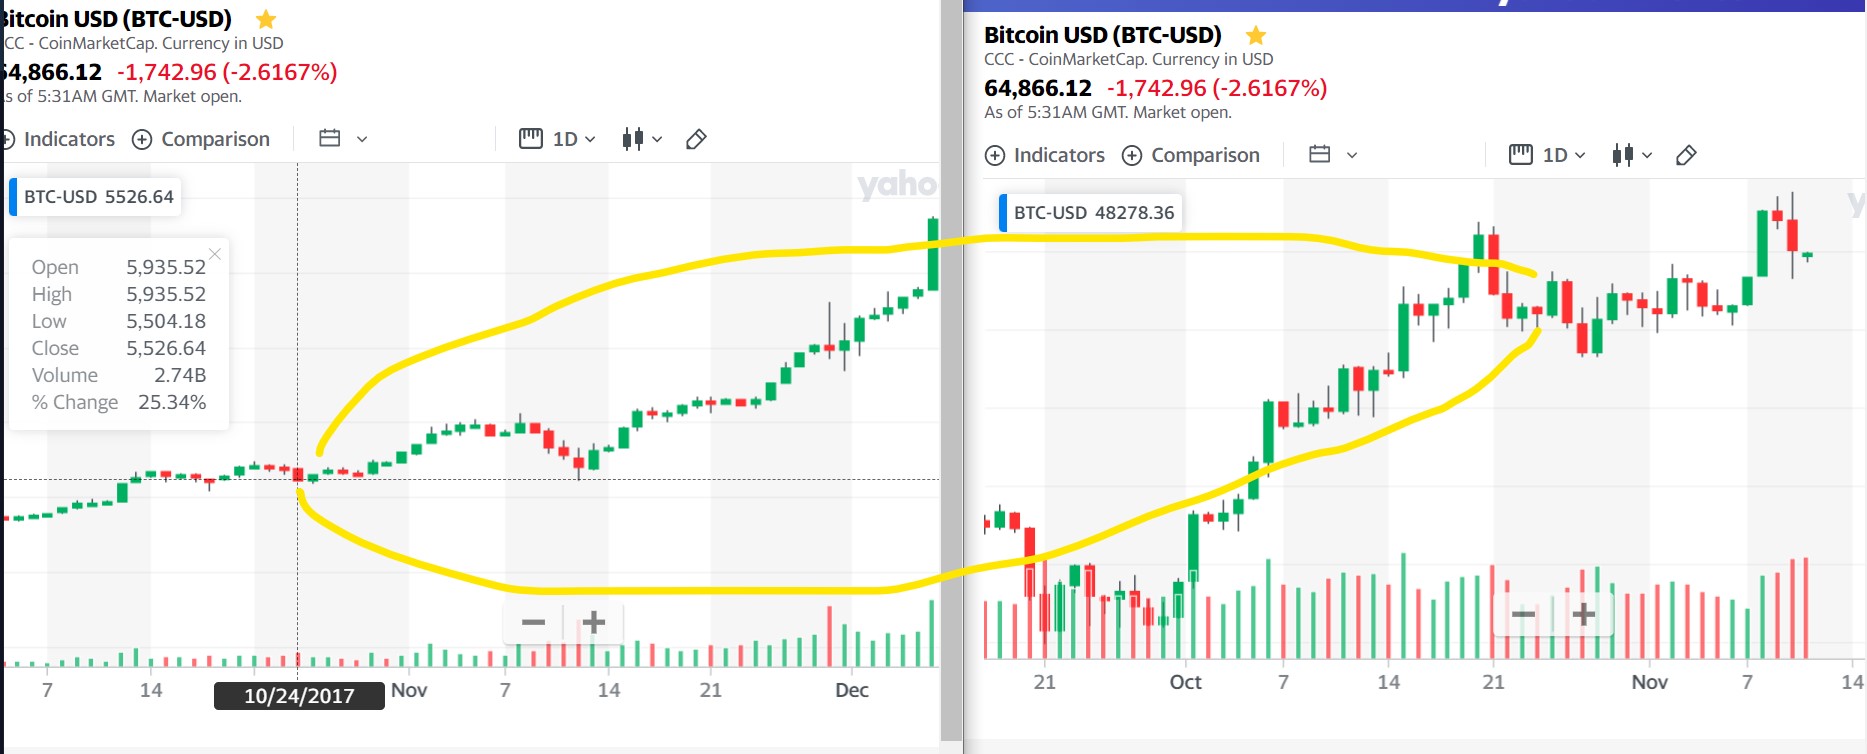
Below is a comparison of BTC October 2017 chart vs BTC October 2021, notice the rise
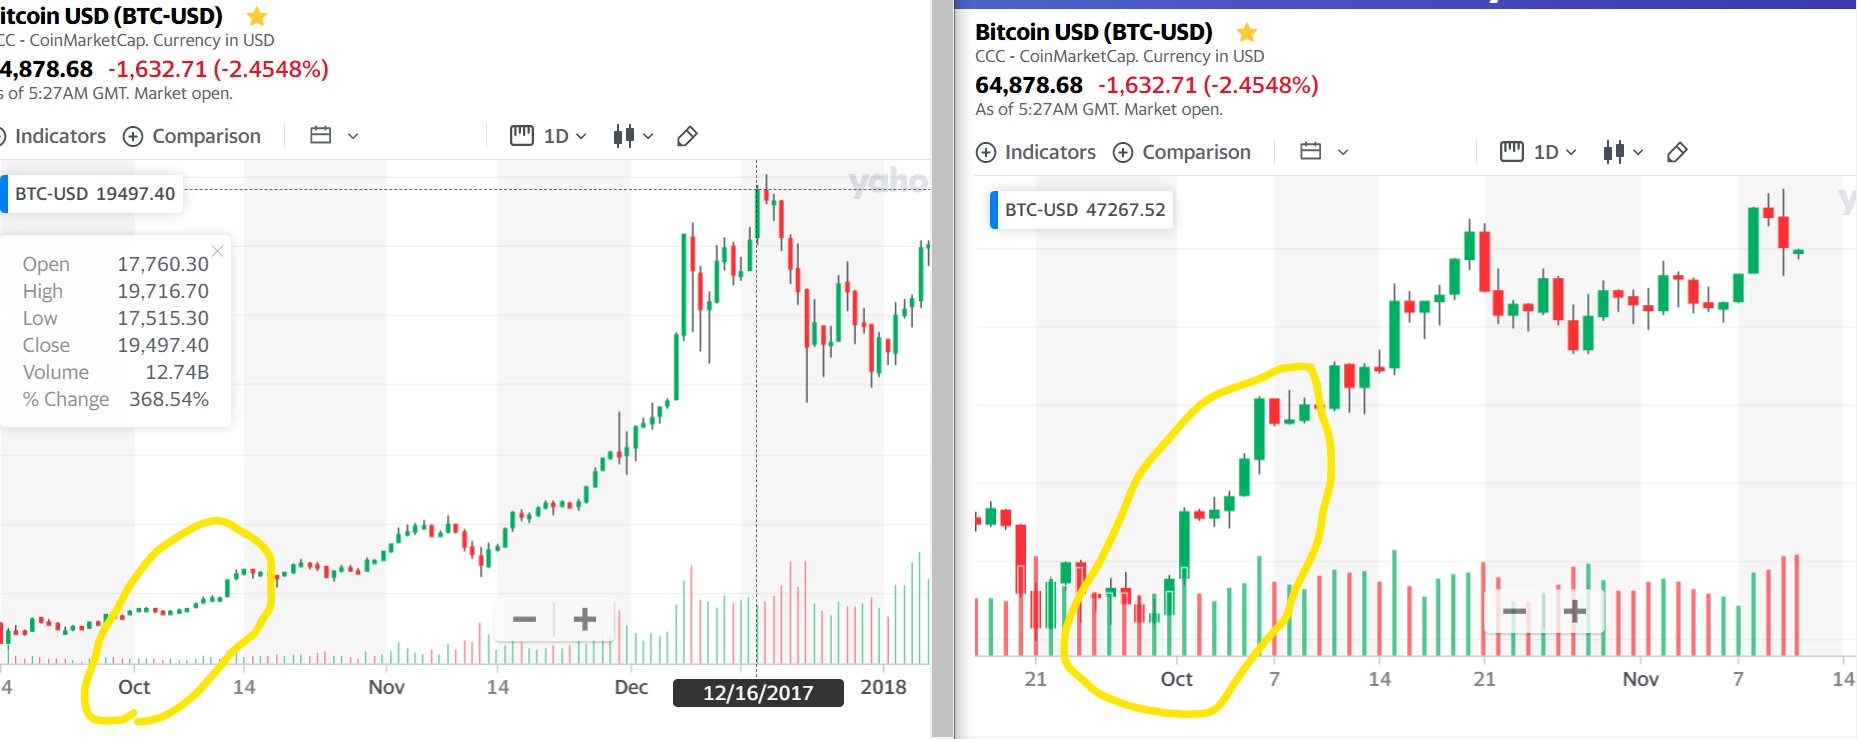
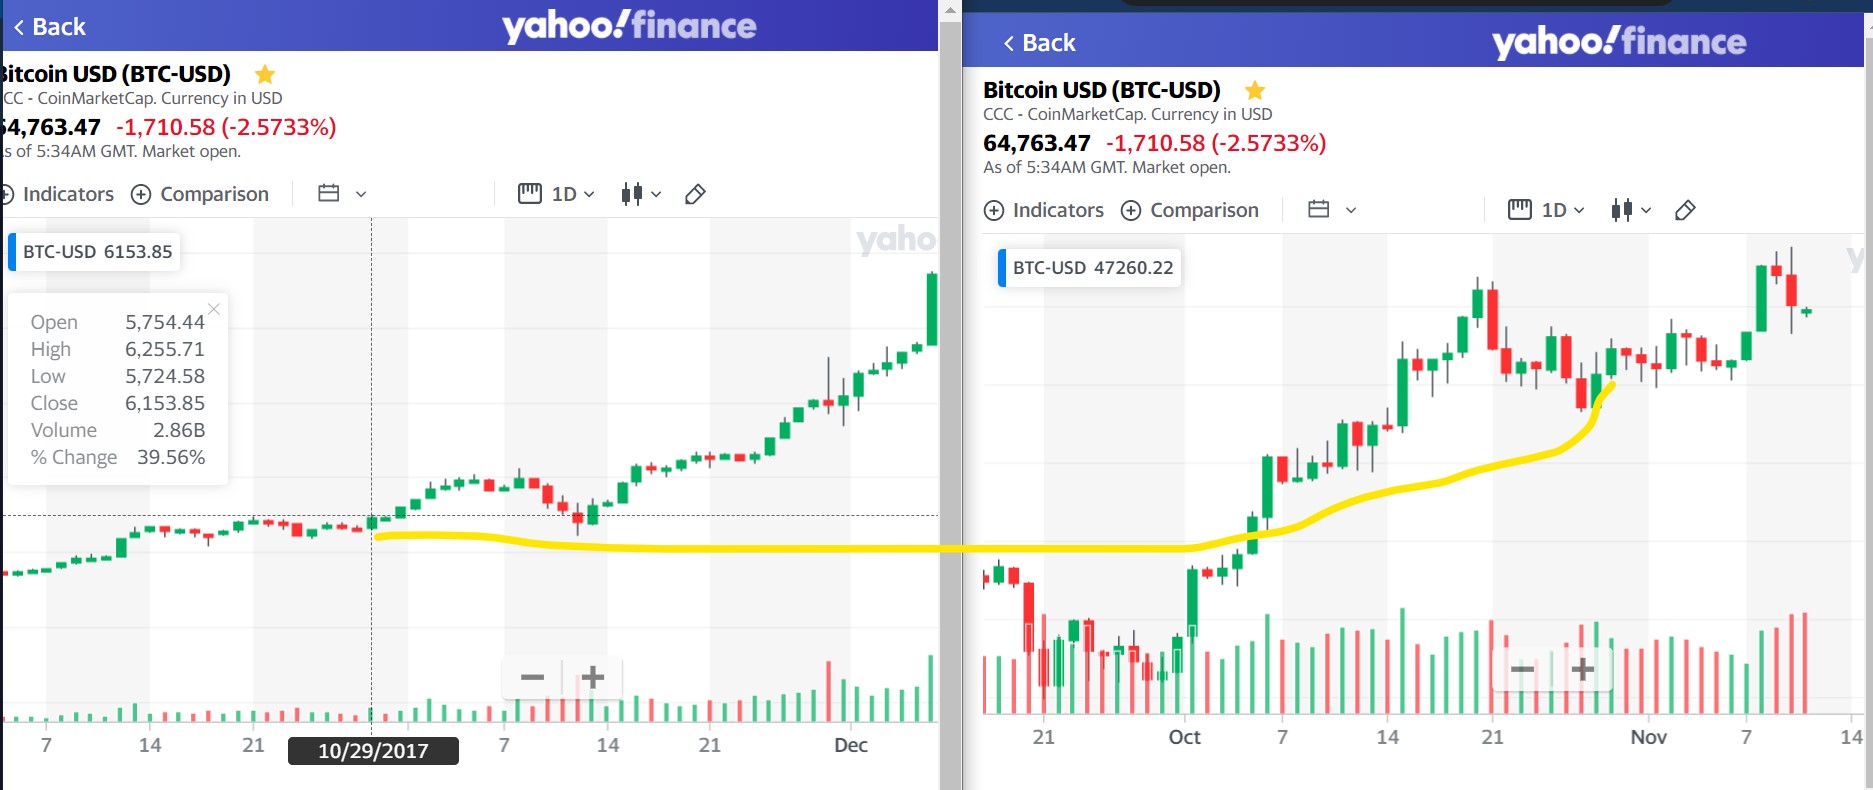
let's start to zoom in so you can see better. The left side in 2017 and the right side is 2021
October 20
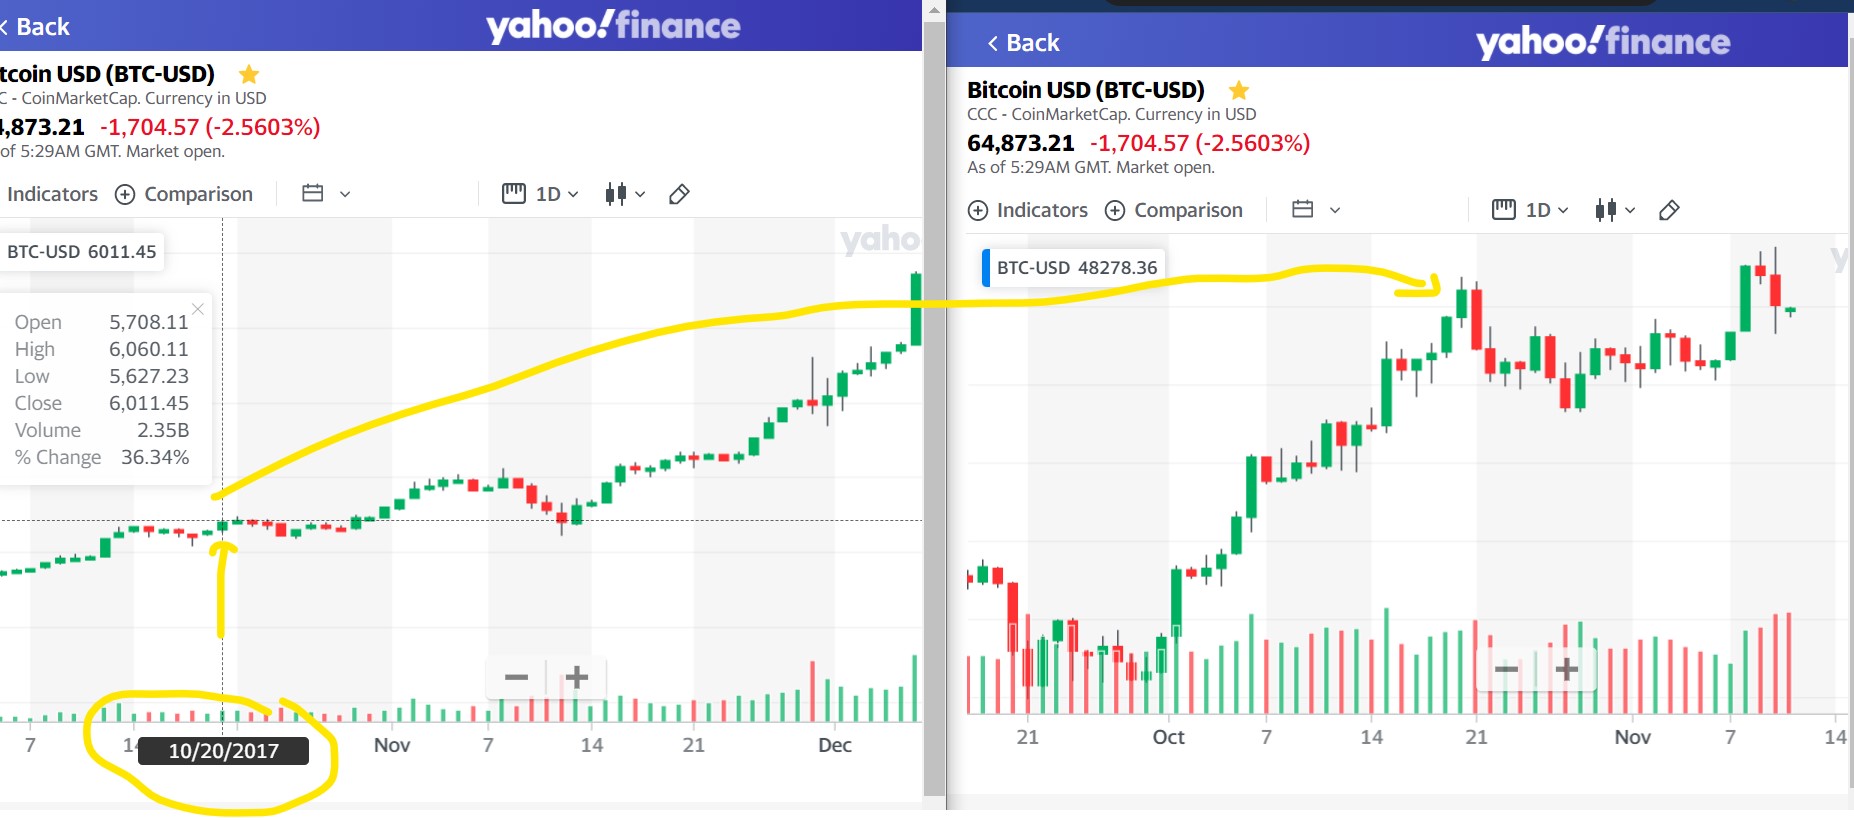
October 24, a red candle and then a green
then October 29, a high green candle from a red candle
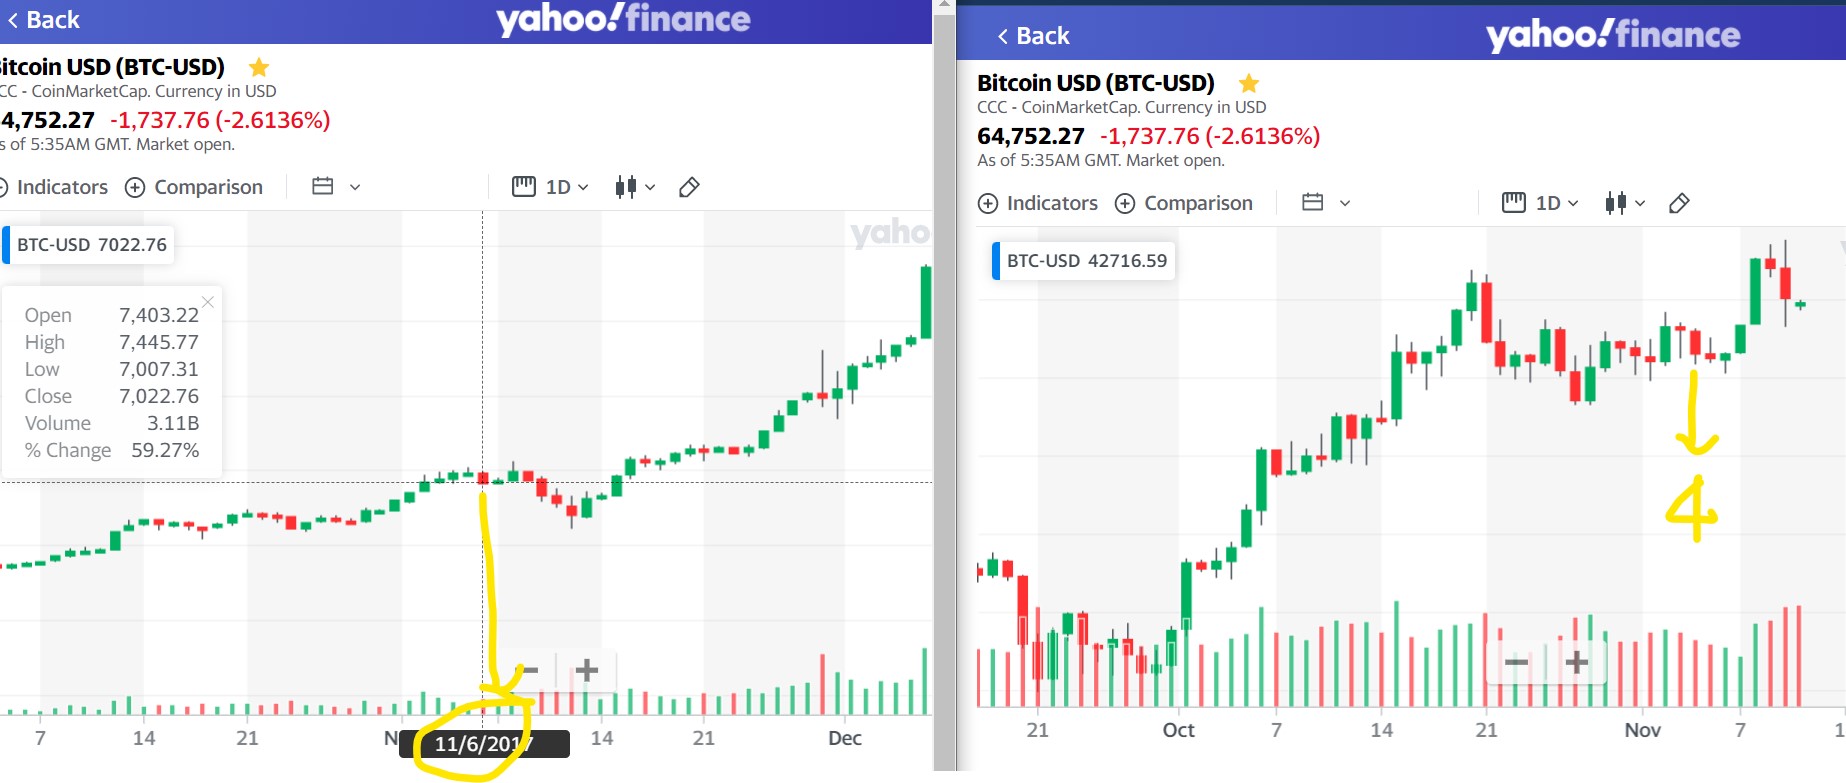
Then things gets more interesting. November 6 2017 a drop from the green but this time its November 4 2021
NOW THIS! November 7 to 8 a spike from the low, you can guess it now, noticed the red candles after the spike
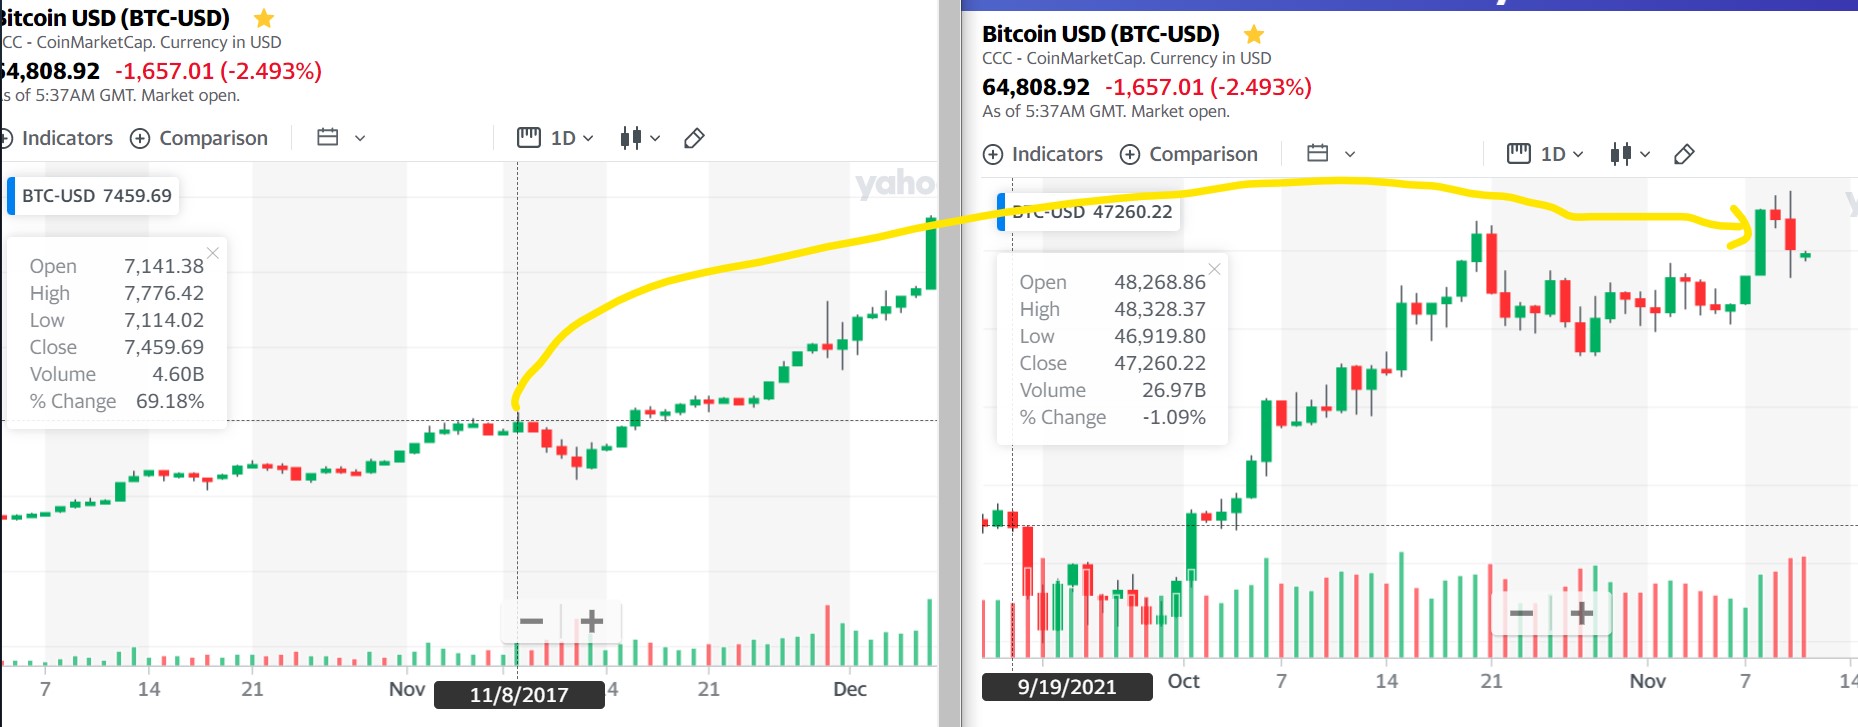
November 9 2017 a pull back correction starts to drop and gradually moved up with a healthy growth until mid december when it started the parabolic growth
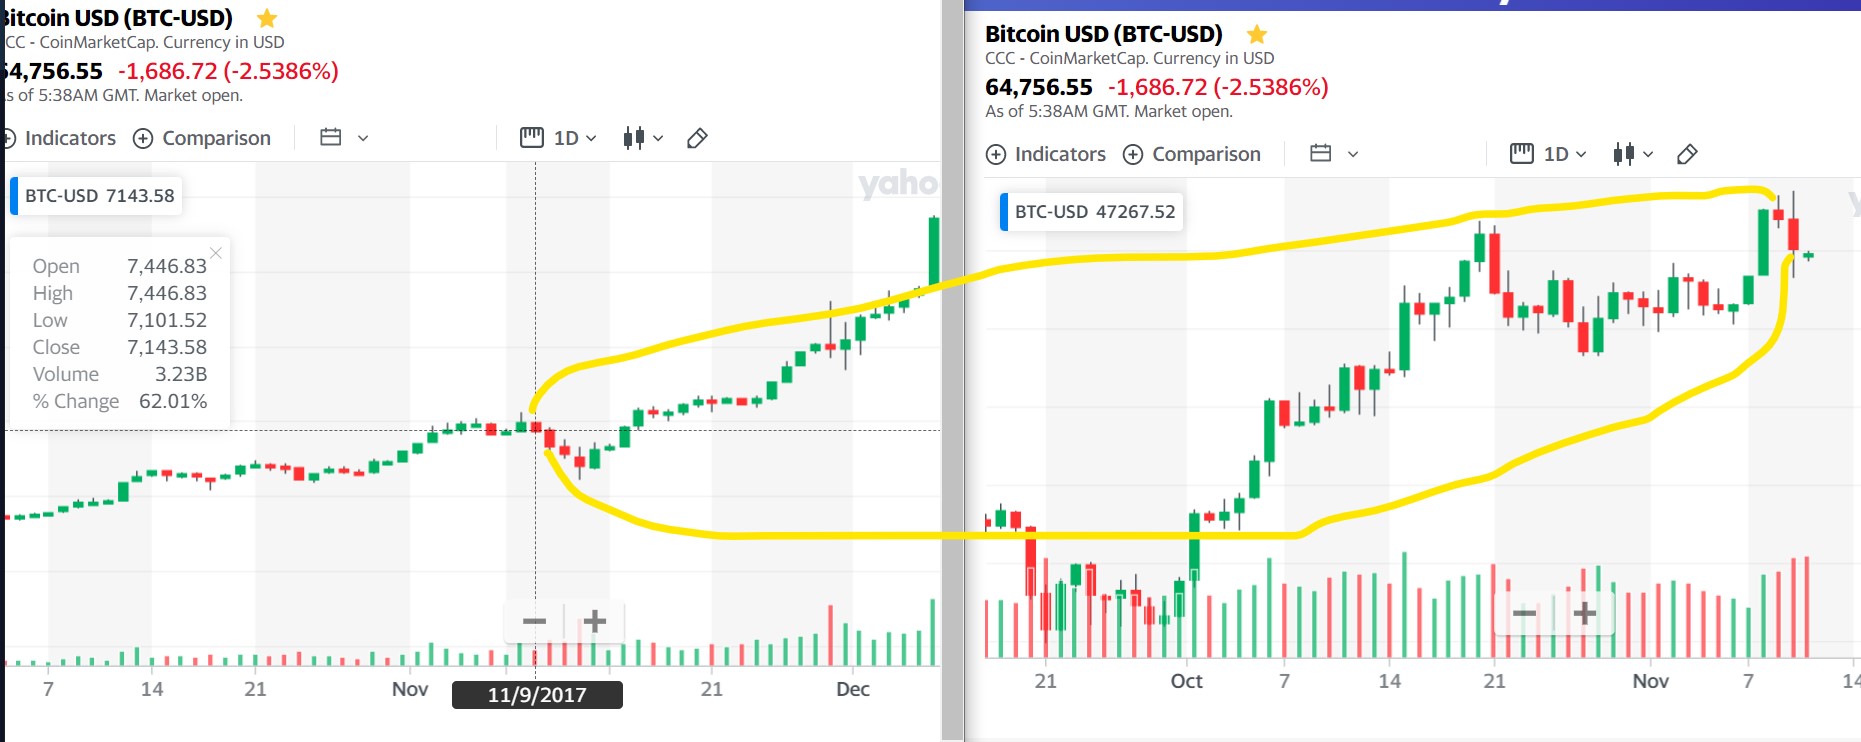
so as of this writting NOVEMBER 11 2021, BTC just dropped. Leverage got liquidated, as we started to run people started to go greedy and did leverage, whales played dropped the bomb, people got liquidated, BTC price down and they bought it for hold.
If this concept runs true, after this red candles it will be a good healthy growth, then projecting 3 shakeoffs notice the november volume for red is big, this are the leverage and people started to be bullish with the constant growth, which is last shakeoff before the spike, this shakeoff cleans the new entry, since if you got in at an earlier time, this shakeoff wont matter. Then as soon as the ATH happens whales will try to dump to shake people out for another buy, this is mixed with leverage again, greed kicks in because of bullish moves, then another run until it looses it for the ALTs as by this time alts will be shooting up since people are taking some profits and putting in to alt coins that can pump.
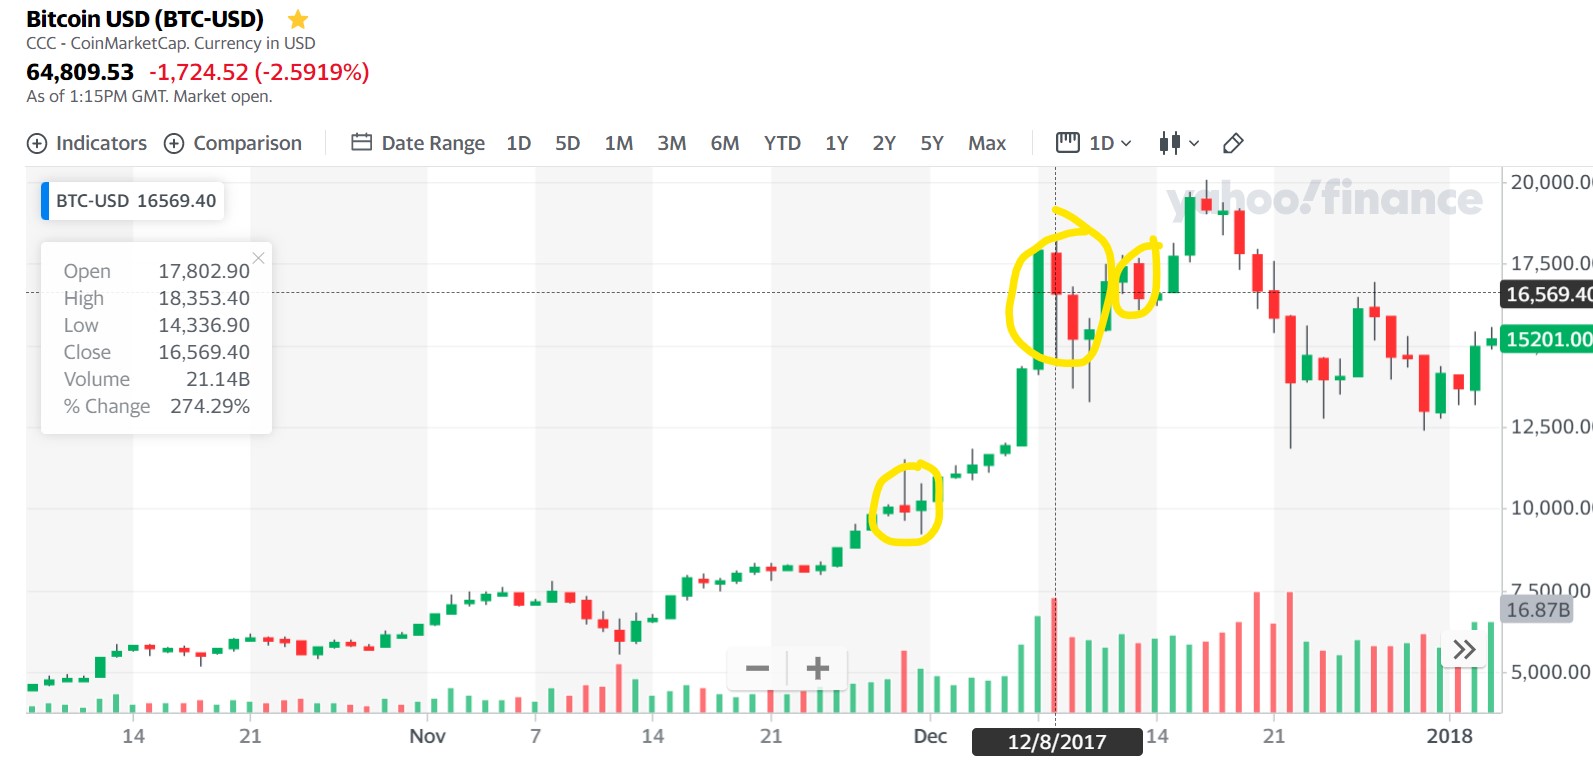
We will see if history repeats itself
